Overview

In the last 12 months, the world has felt the heat in data and lived experiences. This lengthy warmth isn’t just a number; it translates into an uptick in the deadliest weather-related hazard—heat waves.
The global alarming surge in their frequency and intensity aligns with the repercussions of carbon pollution, primarily coal, oil, and natural gas combustion.
Unprecedented Heat: A Soaring Trend in Global Temperatures
The past 12 months have been inscribed into the climate record as the hottest stretch ever, with an average temperature surpassing 1.3°C.
Before this stretch, the record holder was 12 months from October 2015 to September 2016, with a temperature of 1.29°C above the pre-industrial baseline (1850-1900). The latest 12-month period, from November 2022 to October 2023, put the global average temperature at 1.32°C above the pre-industrial baseline.
Illustrated below is a robust trend in global average temperatures, a trajectory fueled predominantly by the outcomes of human activities—especially the release of excess greenhouse gases through activities like burning coal, oil, and natural gas.

The driving forces behind this warming trend are the increasing emissions of heat-trapping gases, with a slight offset from reduced aerosol pollutants that have a cooling effect.
Global Heat Divide: A Closer Look at Climate Impact Disparities
The repercussions of record-breaking global temperatures have left an indelible mark on the planet. Still, the effects were far from uniform across time and geography.
In the initial half of the November-to-October period, certain regions—western North America, northern South America, southern Africa, and Australia—experienced temperatures below the 1991-2020 averages. 67% of the land surface and 83% of the global population were in warmer-than-average conditions.

However, as the months outstretched, a significant shift occurred. The latter six months saw a considerable escalation, with a staggering 90% of the land surface and 92% of the global population grappling with above-average temperatures.

What is the CSI?
The Climate Shift Index (CSI) is a crucial metric for decoding the influence of human-caused climate change.
A CSI level of 0 signifies no detectable impact, indicating a day’s temperature is equally likely in the current climate and untouched by global warming.
As the scale ascends from 1 to 5, positive CSI levels mark increasing likelihood in today’s environment, with each level corresponding to multipliers—2 implies at least two times more likely, three at least three times more likely, and so on.
India’s Climate Shift Index: Unveiling 12-Month Trends
Delving into India’s climate landscape over the past 12 months, from November 2022 to October 2023, displays a subtle picture through the Climate Shift Index (CSI).
The mean CSI for this period stands at 1.0, suggesting a detectable influence of human-caused climate change.

Breaking it down further, the mean CSI for the initial half, from November 2022 to April 2023, is notably lower at 0.3, indicating a milder impact during these months.
However, from May 2023 to October 2023, the latter half saw a significant uptick with a mean CSI of 1.6, signalling a more pronounced influence of climate change on temperatures during this period.
CSI Surge: India’s Regional Shifts in Climate Impact
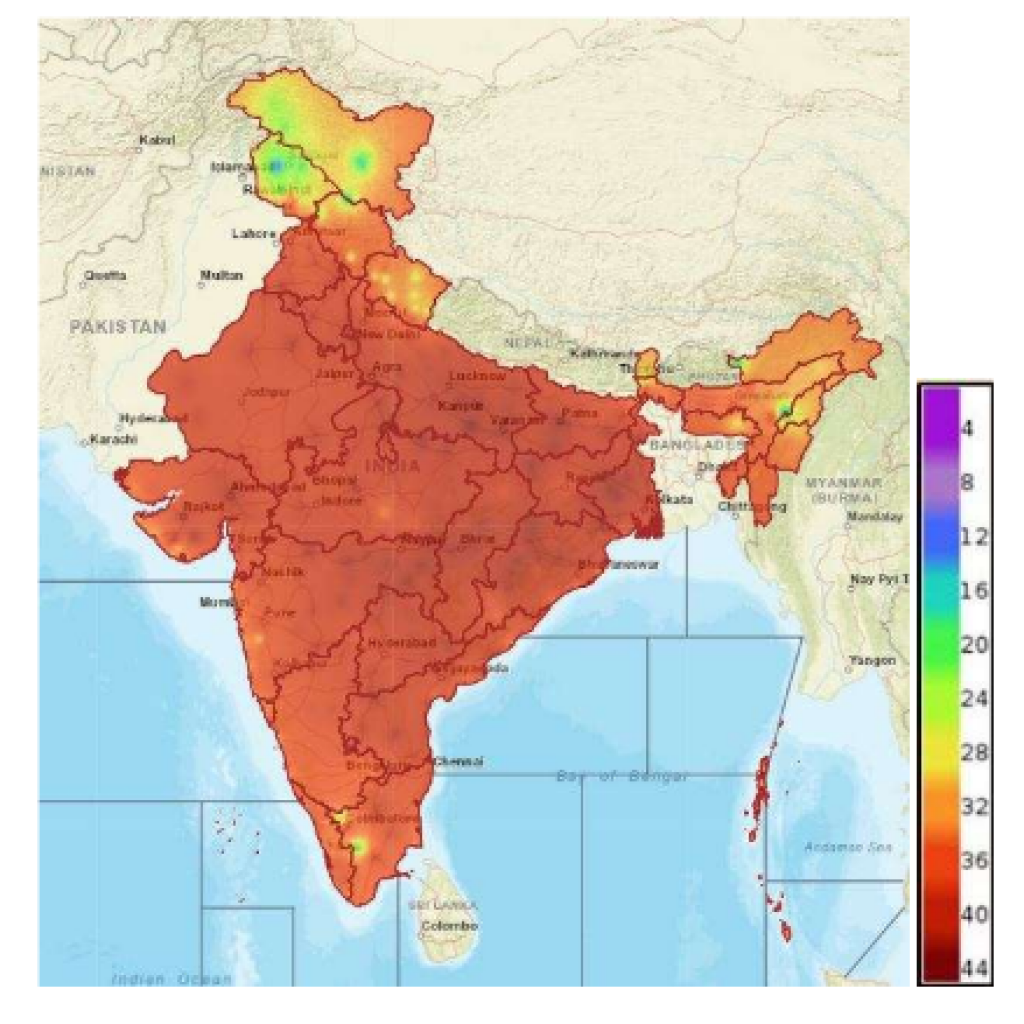
During the latter half of the year, India glimpsed an uptick in state-equivalent administrative districts with a Climate Shift Index (CSI) value exceeding 1.
The impact of human-caused climate change differed across regions, with considerable increases in several states.
Kerala led the charge with a significant CSI of 3.6, followed closely by Goa (3.4), Andaman & Nicobar Islands (3.3), and Puducherry (3.2). The trend continued through Karnataka (3.0), Meghalaya (2.9), Manipur (2.8), and Tripura (2.8).
Rising Heat: A Global Perspective on Extreme Conditions
One in four people experienced extreme heat waves intensified by climate change this year.
The analysis highlights the global impact, revealing that 61% of the world’s population, totalling 4.9 billion people, experienced more than five days of locally extreme temperatures.

Furthermore, 2.1 billion individuals (26%) endured five or more consecutive days of these extremes, with an additional 1.9 billion (24%) facing a five-day heat streak with a distinct climate fingerprint—a CSI level of 2 or higher, indicating that human-caused climate change amplified the likelihood of these temperatures by at least two times.
The scorching impact of climate change extended to 156 cities, subjecting them to extreme heat streaks lasting five days or more. Notably, 144 of these cities experienced streaks with an average Climate Shift Index (CSI) of 2 or higher, underlining the apparent influence of human-caused climate change.
These impactful streaks were dispersed across 37 countries, encompassing major metropolises like Tokyo, Jakarta in Indonesia, Mumbai in India, Mexico City, and London.
Conclusion
The past 12 months have carved a scorching chapter in our global climate narrative, with remarkable heat touching every corner of the world. More than 9 in 10 people experienced heat significantly intensified by human-caused climate change.
While these records are unprecedented, they are not unforeseen. We are amid a warming trend resulting from relentless and severe carbon pollution.

The path ahead is evident: as long as we trust coal, oil, and natural gas, temperatures will soar, and the repercussions will intensify and increase. This analysis is a striking reminder of the urgent need to cut emissions and curb the warming trajectory.
Our actions to shrink our carbon footprint extend beyond environmental considerations; they are paramount for developing a greener, cleaner planet. By adopting sustainable practices today, we are not only fostering a healthier environment but also securing the well-being of people worldwide, both in the present and for the generations yet to come.
Also Read: Groundwater Crisis: UN’s Interconnected Disaster Risks Report 2023


Comments 4